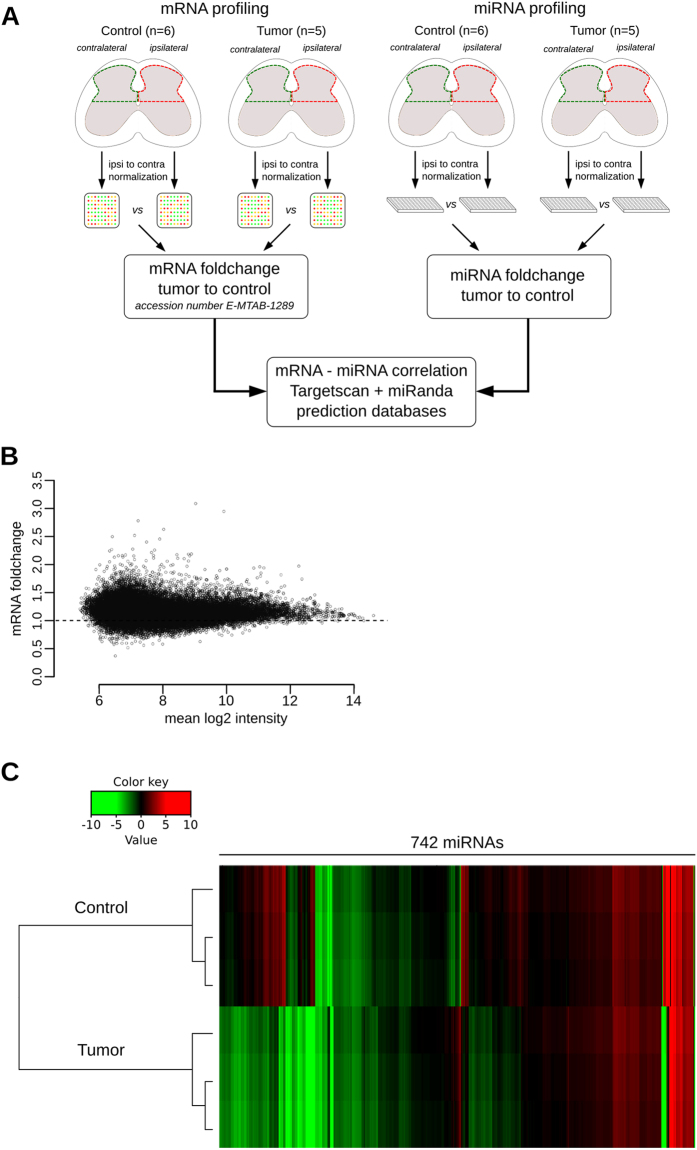
Figure 2.
Profiling of mRNAs and miRNAs in the spinal cord of cancerous mice. (A) Schematic representation of RNA screening strategy. (B) MA plot representing differential expression of mRNAs in bone-cancer-pain condition compared to control condition: 3909 mRNAs differentially expressed. (C) Heatmap representation of miRNA expression in cancerous versus naive mice: out of 742 miRNAs tested, 525 miRNAs were differentially expressed with 175 up-regulated (fold change > 2) and 350 down-regulated (fold change < 0.5).

