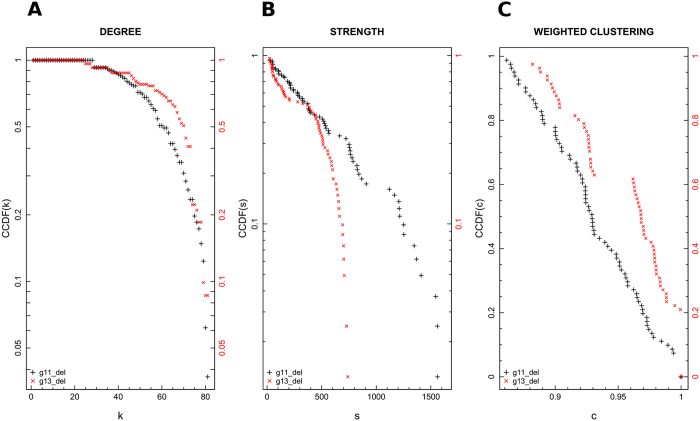
Figure 3.
Complementary cumulative distribution functions (CCDF) of degree and strength are reported in log-line scale in panel (A,B), respectively, for both (black crosses) and (red crosses). Panel (C) moreover, shows weighted clustering coefficient distribution. More precisely, CCDF (on y-axis) is plotted versus the weighted clustering parameter (x-axis) on linear scale. The isolated nodes were not taken into account for the corresponding network’s basic metric analysis.

