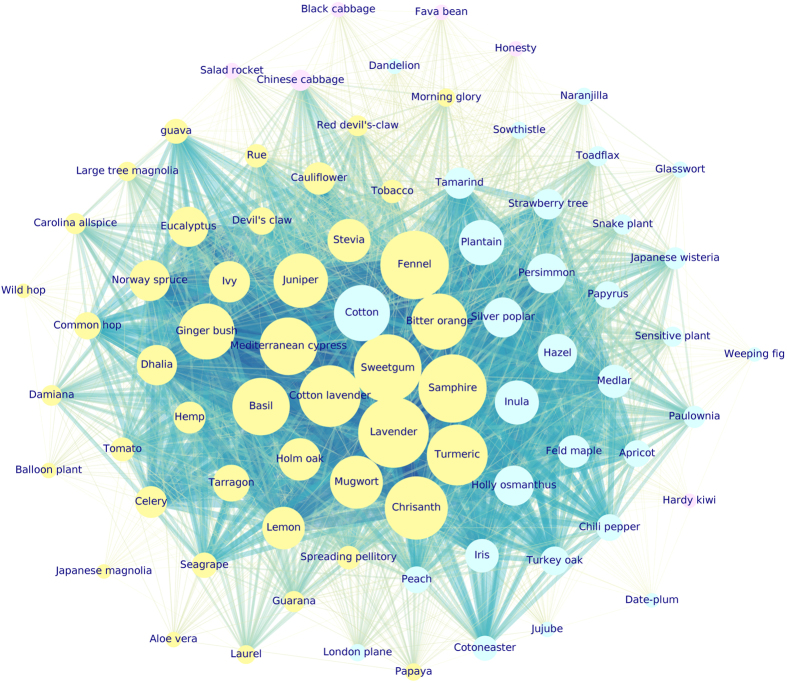
Figure 4.
third-quartile-based graph. Each color corresponds to one detected community: cluster 1 (yellow), cluster 2 (aqua), cluster 3 (violet). The 28 isolated nodes are not shown (cluster 4). Nodes dimension is proportional to nodes weighted degree. Edges thickness is proportional to the edges weight. Lavandula spica L. (Lavander), Foeniculum vulgare Mill. (Fennel), Crithmum maritimum L. (Samphire), Liquidambar styraciflua L. (Sweetgum), visible as biggest yellow nodes, are some of the most active species in terms of VOCs emissions.

