Figure 2.
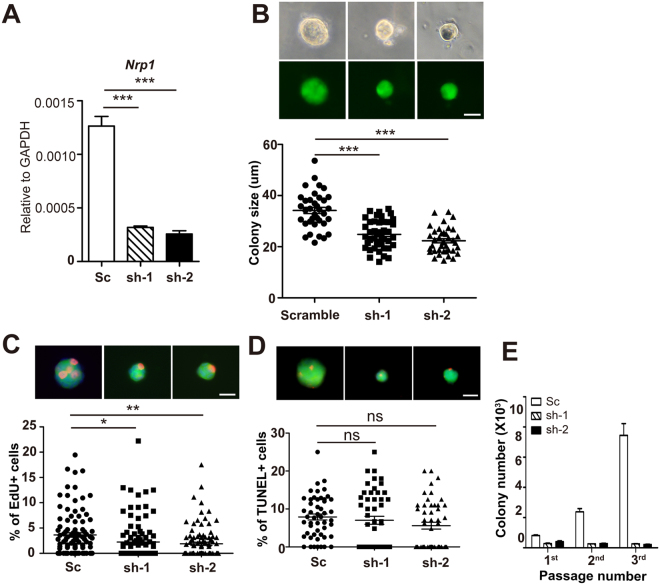
Nrp1 expression is important for MaSC colony formation in vitro. (A) qPCR analysis validating the Nrp1 knockdown efficiency of two independent shRNAs. Data are pooled from three independent experiments, are presented as mean ± SEM. ***P < 0.001. (B) Representative images of colonies upon infection with scramble or Nrp1 shRNAs (sh-1, sh-2) viruses (top panels), and quantification of colony sizes at cultured day 6 (bottom panels). Each dot represents one colony. Scale bar, 20 μm. Data are presented as mean ± SEM. ***P < 0.001. (C) Representative images of EdU labeled basal colonies (top panels). EdU+ cell percentages (EdU+ cells/DAPI+ cells in each colony) were quantified at day 6 (bottom panel). Each dot represents one colony. Scale bar, 20μm. Data are presented as mean ± SEM. *P < 0.05, **P < 0.01. (D) Representative images of TUNEL staining of basal colonies (top panels). TUNEL+ cell percentages (TUNEL+ cells/DAPI+ cells in each colony) were quantified at day 6 (bottom panels). Each dot represents one colony. Scale bar, 20μm. Data are presented as mean ± SEM. (E) Serial passage of basal colonies after lentiviral infection with scramble or Nrp1 shRNAs. The colony numbers of each passage were quantified.

