Figure 6.
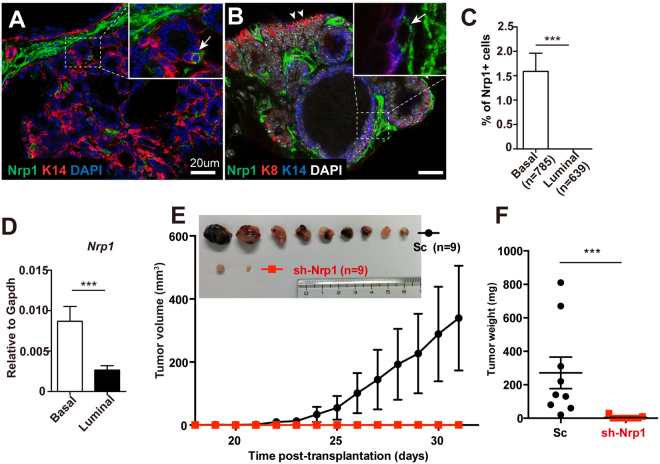
Knockdown of Nrp1 inhibits MMTV-Wnt1 tumor growth. (A–C) Immunostaining indicating the expression of Nrp1 (green) in MMTV-Wnt1 tumor sections. Basal cells were marked by K14 expression (red in A, blue in B), luminal cells were marked by K8 (red in B). Nrp1+K14+ cells were indicated by arrows (A and B). K8+ cells were indicated by arrowheads (B). The percentages of Nrp1+ cells were quantified in basal and luminal populations (C). Scale bar, 20 μm. Data are presented as mean ± SEM. ***P < 0.0001. (D) qPCR analysis of FACS-isolated basal and luminal cells in the tumor indicating Nrp1 expression is higher in basal cells. Data are pool from three independent experiments and presented as mean ± SEM. ***P < 0.0001. (E,F) Primary cells were isolated from MMTV-Wnt1 tumor and infected with scramble (Sc) or Nrp1 shRNA (sh-Nrp1) lentivirus. After 6 days of culture, infected cells were FACS-sorted and injected into fat pad of 8-week-old nude mice. Tumor volume was measured as indicated (E). Inserted image showing the tumors harvested at day 31 post surgery (E). Tumor weights were measured at day 31 post surgery (F). Data are pooled from three independent experiments and presented as mean ± SEM. ***P < 0.0001.

