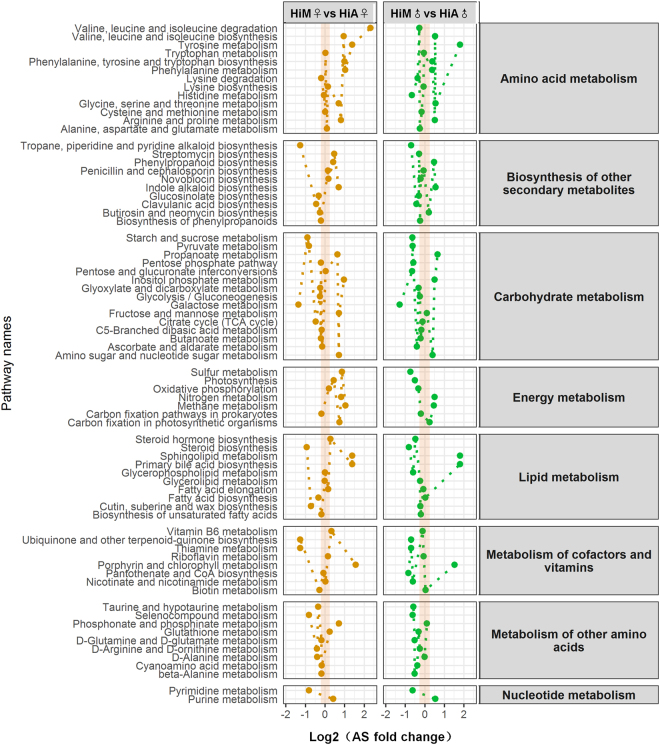
Figure 5.
Heat map analysis of differential metabolic pathways in silkworms reared on the artificial diet or mulberry leaves. The Hi silkworm strain was used for the comparison between genders. The analysis was based on a visual analysis of metabolic pathways62. A pathway activity profiling (PAPi) algorithm was used to calculate the activity score (AS) for each metabolic pathway, and the calculated PAPi and the relative abundance of each metabolic pathway were based on the Kyoto Encyclopedia of Genes and Genomes (KEGG) database. The metabolic pathway heat map was produced based on the KEGG metabolic process classification, and an analysis of variance was used for the statistical test (P < 0.05 indicates significance). Different circles represent the AS values of different metabolic pathways.

