Figure 1.
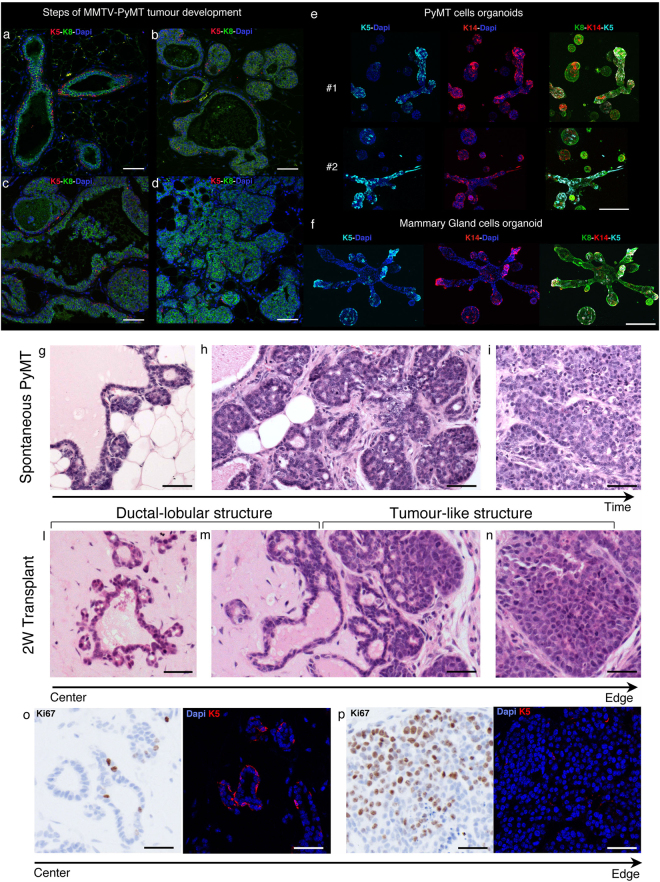
Development of spontaneous and transplanted MMTV-PyMT tumours. (a–d) Immunofluorescence images of spontaneous MMTV-PyMT tumour development. Staining for; cytokeratin-5 (K5; red), cytokeratin-8 (K8; green) and DAPI (blue). Representative images are shown for: (a) Ductal structures with K8 positive luminal cells surrounded by K5 positive basal cell lining, (b) hyperplasia, (c) adenoma-like growth and (d) carcinoma-like growth. Scale bar: 50 µm. (e–f) Immunoflourescence images of organoids from primary PyMT tumour cells (e) or primary normal mammary epithelial cells (f) cultured in matrigel/collagen gels for 2 weeks. Cultures are stained for cytokeratin-5 (K5; cyan), cytokeratin-14 (K14; red), cytokeratin-8 (K8; green) and DAPI (blue). Scale bar: 200 µm. (g–i) Haemotoxylin and Eosin (H&E) staining of different stages of tumourigenesis from 10-week old MMTV-PyMT Mammary gland (FVB). Representative images of (g) hyperplasia, (h) adenoma transition and (i) carcinoma. Scale bar: 50 µm. (l–n) H&E staining of primary PyMT tumour 2 weeks post-transplantation in growth factor reduced matrigel. Representative images show ductal-lobular structures within the centre of the plug (l); transition from a ductal-lobular structure to more tumour-like growth towards the edge of the plug (m); carcinoma-like growth at plug’s edge (n) Scale bar: 50 µm. (o–p) Ki67 DAB staining (left panel) and immunofluorescence staining for cytokeratin-5 (K5; red) and DAPI (right panel) of ductal-lobular structures (o) and tumour-like growth (p). Scale bar: 50 µm.

