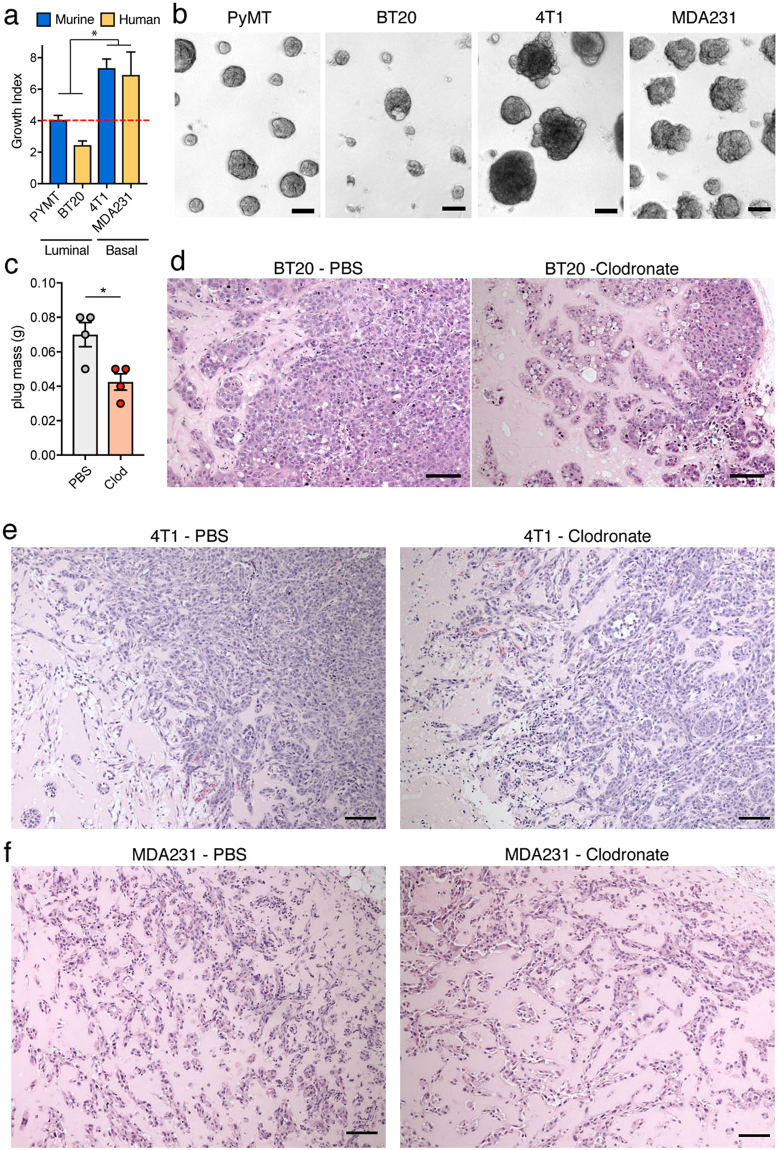
Figure 6.
Different lines grow differently in Matrigel in vitro and differently require macrophages in vivo. (a) Quantification of the indicated cancer cell lines growth in vitro on growth factor reduced matrigel. *P value < 0.05 (two-way ANOVA between the growth of luminal vs basal cells) (b) Bright field images of the indicated cancer cell lines on matrigel. Scale bar: 100 µm. (c) Mass of BT20 transplanted and growth for 7 weeks either with PBS or Clodronate liposomes in growth factor reduced matrigel. *P value < 0.05 (n = 4, two tail T-test) (d) H&E of BT20 tumours in c. Scale bar: 100 µm. (e) H&E of 4T1 transplanted grown for 1 week either with PBS or Clodronate liposomes in growth factor reduced matrigel. Scale bar: 100 µm. (F) H&E of MDAMB231 transplanted grown for 1 week either with PBS or Clodronate liposomes in growth factor reduced matrigel. Scale bar: 100 µm.

