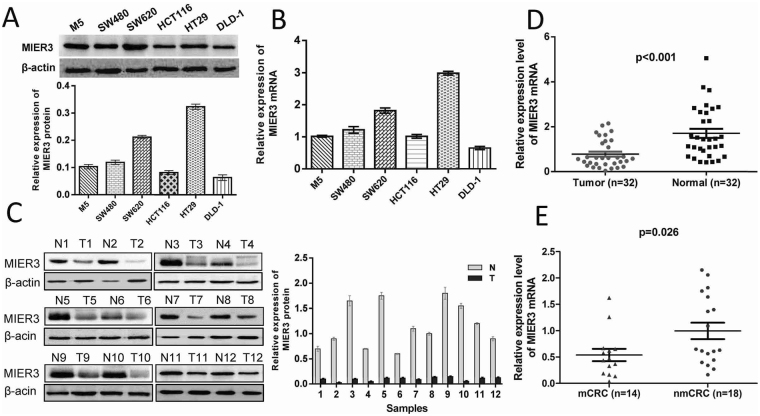
Figure 1.
Expression of MIER3 mRNA and protein in CRC cells and colorectal tumor tissue samples. (A) Expression of MIER3 protein by western blotting (above). The protein expression levels were quantified by comparing the gray level of each band using Quantity One Software (below). Data are the means ± SD from 3 parallel experiments. (B) Expression of MIER3 mRNA by real-time PCR in six CRC cell lines. Expression levels of MIER3 mRNA were normalized with β-actin mRNA levels. Error bars represent the mean ± SD calculated from 3 parallel experiments. (C) Expression of MIER3 protein in each of the primary CRC (T) and adjacent noncancerous tissues (N) paired from the same patient by western blotting (left) (n = 12). The protein expression levels were quantified by comparing the gray level of each band using Quantity One Software (right). Error bars represent the mean ± SD calculated from 3 parallel experiments. (D) Expression levels of MIER3 mRNA by real-time PCR in paired CRC and adjacent normal tissues (n = 32). Expression levels of MIER3 mRNA were normalized with β-actin mRNA levels. Error bars represent the mean ± SD calculated from 3 parallel experiments. (E) MIER3 expression in CRC tissues with or without metastases. nmCRC denotes CRC tissues without metastases; mCRC denotes CRC tissues with lymph node metastases.

