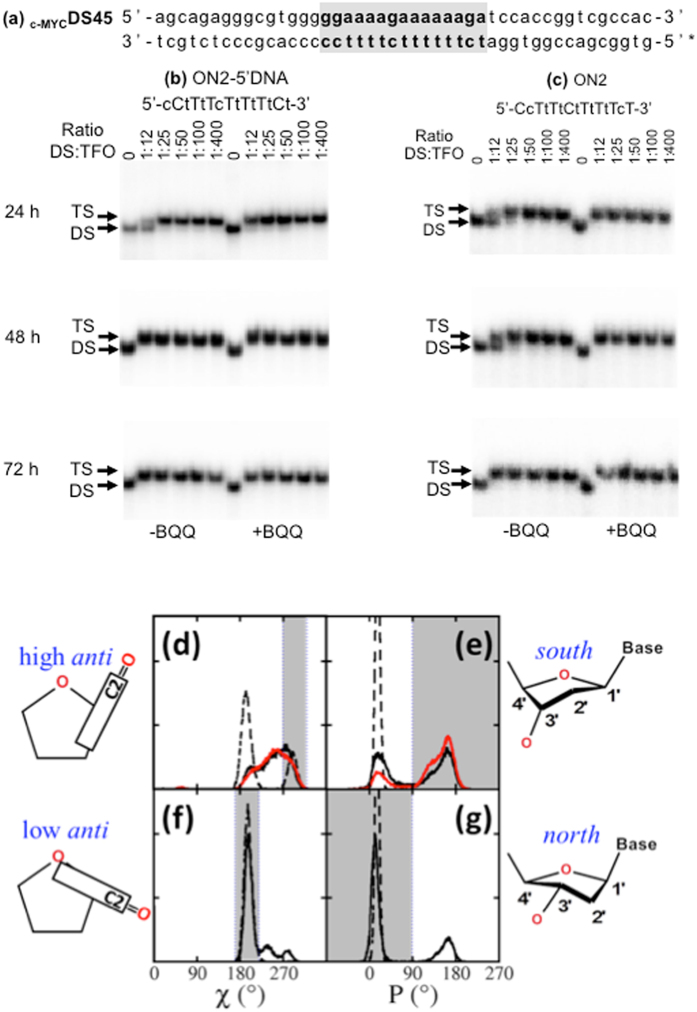
Figure 2.
TFO binding of 15-mer ON sequences: (a) c-MYCDS45 and electrophoretic mobility shift profile of c-MYCDS45 in the presence of (b) ON2-5′DNA and (c) ON2. Hybridization with ON in the absence (left side) and in the presence (right side) of BQQ carried out during 24, 48 and 72 h. Triplex structures are detected as slower migrating bands. DNA duplex and triplex complexes are indicated as DS and TS, respectively. LNA is indicated in capital letters and DNA is in small letters. Distribution of glycosidic torsion (χ) and ribose pseudorotation (P): (Panels d and e) ON2-5′DNA (black) and ON1 (red) strands free in solution. (Panels f and g) ON2-5′DNA bound to the c- MYCDS19. The sketches of base pair orientation and sugar pucker beside the graphs depict the conformation corresponding to the gray regions in the panel.

