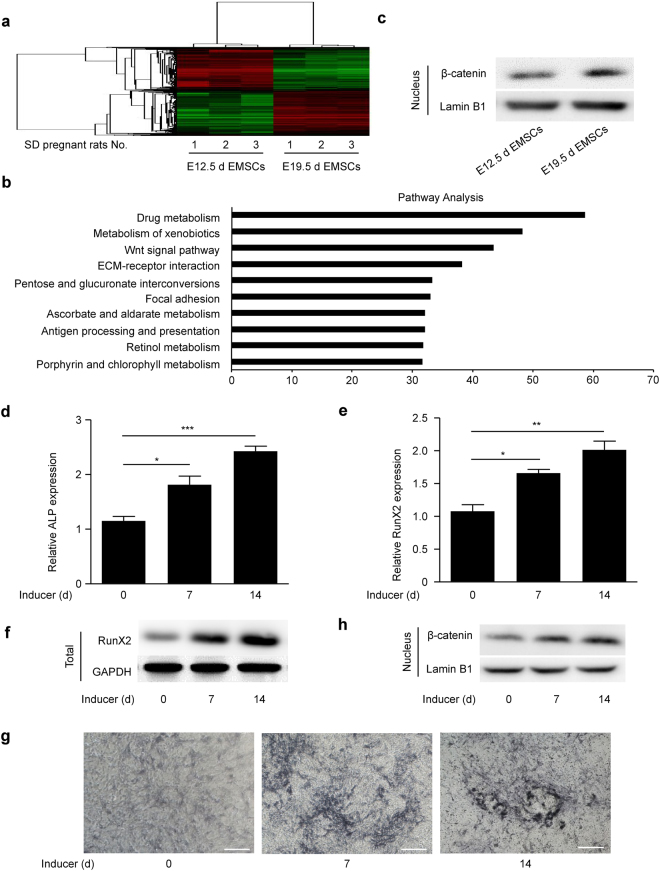
Figure 2.
Nuclear β-catenin is upregulated during EMSC osteogenic differentiation. (a) Clustering analysis showed the differentially expressed genes between EMSCs separated at E12.5d and EMSCs separated at E19.5d. (b) Pathway analysis shows the pathways that the differentially expressed genes are involved in. (c) Nuclear β-catenin protein levels in EMSCs separated at E12.5d and E19.5d were detected by Western blot. Full-length blots are presented in Supplementary Figure S1a. (d–h) EMSCs separated at E19.5d were treated with osteogenic induction solution for 14 days. The osteogenic induction solution was changed every three days. The cells were harvested on days 0, 7 and 14 during osteogenic induction. Subsequently, (d) ALP and (e) RunX2 mRNA levels were detected by qPCR, (f) RunX2 protein levels were detected by Western blot, (g) the ALP staining depth was observed by optical microscopy, and (h) nuclear β-catenin protein levels in EMSCs were detected by Western blot. The full-length blots of (f) and (h) are presented in Supplementary Figure S1b and c, respectively. GAPDH was used as a total protein control and Lamin B1 was used as a nuclear protein control in Western blot. GAPDH was used as a control in qPCR. Scale bar represents 50 μm. E12.5d EMSCs, ectomesenchymal stem cells separated at E12.5d; E19.5d EMSCs, ectomesenchymal stem cells separated at E19.5d; ALP staining, alkaline phosphatase staining; and Inducer, the osteogenic induction solution. The results represent the mean ± SD from three independent experiments performed in triplicate. *P < 0.05, **P < 0.01, and ***P < 0.001.

