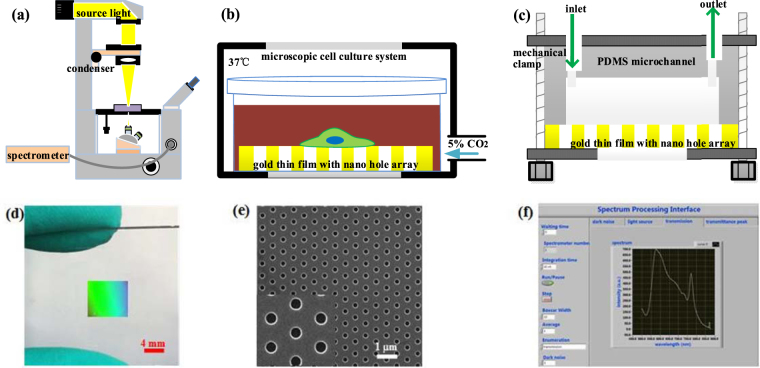
Figure 1.
Experimental setup. (a) Schematic of the optical microscopy setup and device for spectrum measurement. Note: The light beam is indicated in yellow just for visualization purpose, actually white light is projected on the device. (b) Section view of the integrated device used for single cell dynamic attachment measurement. The gold thin film with template-stripped nano-hole array is flat on a petri dish and the whole device is placed in a microscopic cell culture system to maintain the environment of 5% CO2 concentration and 37.0 °C temperature for cell culture and attachment. (c) Section view of the integrated device used for attachment analysis of many single cells. The PDMS microchannel with single cell capture units and gold thin film perforated with hexagonal nano-hole array are combined with a mechanical clamp. The open injection syringe inlet is 10 mm higher than the outlet to produce gravity pressure difference, which is used to slowly infuse cell culture medium during cell culture. (d) Photo of large-area hexagonal nano-hole array on gold thin film with a size of 8 mm × 8 mm. The polychrome color on the gold film is the reflected diffraction light generated by the periodic nano-hole array on gold film. (e) SEM of large-area hexagonal nano-hole array (periodicity 600 nm, diameter 180 nm). (f) Spectrum processing software graphic interface based on LABVIEW.

