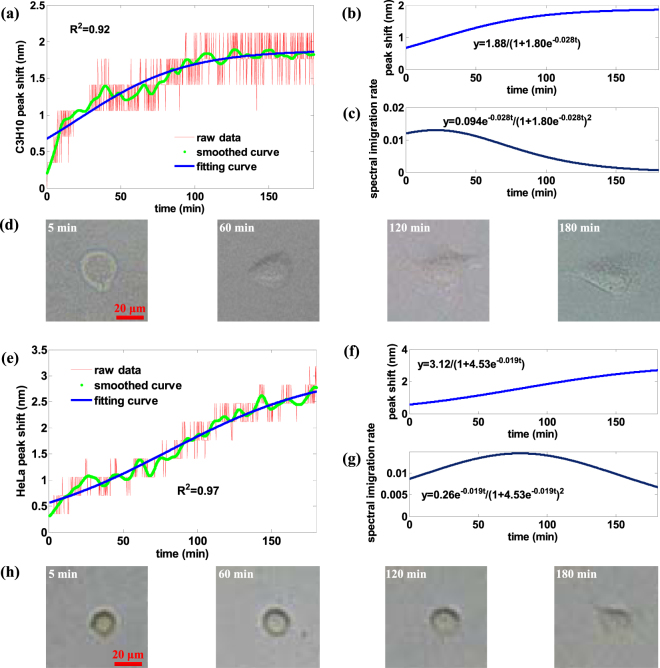
Figure 8.
Experimental results of single cell dynamic attachment process monitoring. (a) Peak shift raw data, smoothed curve and fitted curve of the single C3H10 cell, with fitted R-square of 0.9218. (b) Peak shift smoothed curve and fitted curve of the single C3H10 cell. (c) Spectrum peak change rate of the single C3H10 cell. (d) The microscopic image of C3H10 cell after 5 minutes, 60 minutes, 120 minutes, 180 minutes of measurement. At 5 minutes, its boundary contour is not so round which indicates its tendency of attachment. (e) Peak shift raw data, smoothed curve and fitted curve of the single HeLa cell, with fitted R-square of 0.9732. (f) Peak shift smoothed curve and fitted curve of the single HeLa cell. (g) Spectrum peak change rate of the single HeLa cell. (h) The microscopic image of HeLa cell after 5 minutes, 60 minutes, 120 minutes, 180 minutes of measurement. Compared with the C3H10 cell, the shape of HeLa cell change extent in the same period of attachment time is smaller.

