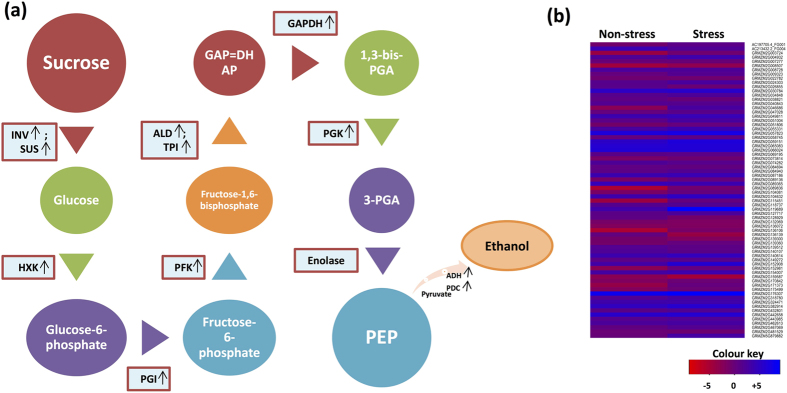
Figure 3.
Energy-production pathways regulated in waterlogging tolerant genotype under stressed condition. (a) Energy-production pathways regulated during waterlogging stress. Here arrows denote the expression level of waterlogging responsive genes in maize roots. Expression level marked here includes greater than 2 fold change. Refer the paper for abbreviations. (b) Heatmap of energy-production pathway regulating genes. X-axis denotes non-stress and stress conditions. Y-axis denotes the gene models of energy-production pathway genes. Refer Table S4 for details of energy-production pathway genes.

