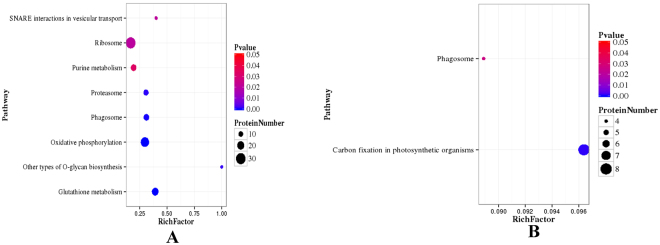
Figure 5.
Pathway enrichment statistical scatter plot of DEPs. (A) UpSHT vs UpHT down-regulated proteins; (B) UpSHT VS UpHT up-regulated proteins; The vertical axis represents the name of the pathway; the horizontal axis represents the pathway corresponding rich factor. The rich factor refers to the ratio of the number of differentially expressed genes in the pathway and the number of all annotated genes in the pathway. Higher rich factors indicate greater degrees of enrichment. Q values are often completed after multiple hypothesis testing with corrected P value values ranging from 0 to 0.05. The closer they are to zero, the more significant the enrichment.

