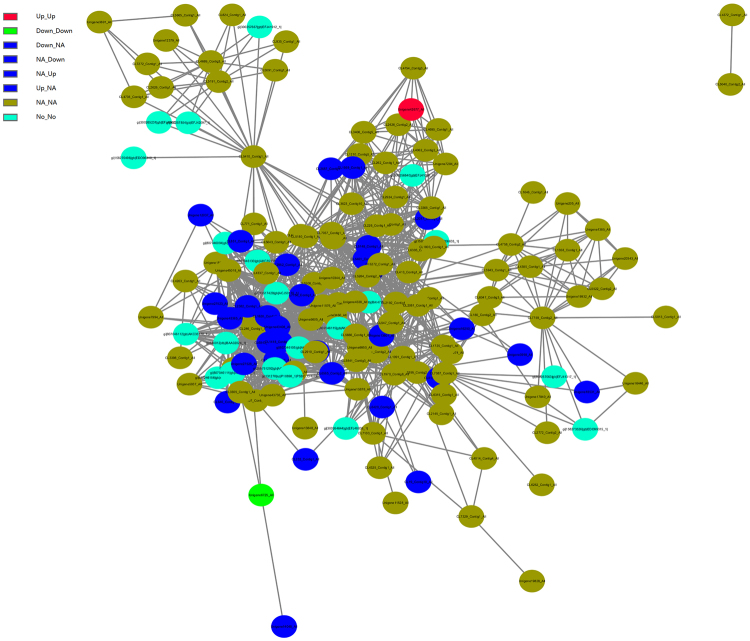
Figure 8.
The protein-protein(portion) interaction network of U. prolifera under UpSHT compared with UpHT condition. These PPI interactions with a combined score larger than 0.4 in the STRING database were extracted to build the network. The gene with different regulatory pattern in protein/transcript level were marked as different color as follows: up/up, Red; down/down, Green; up/NA, down/NA, NA/up, NA/down, Blue; NA/NA, yellow green; No/No, navy.

