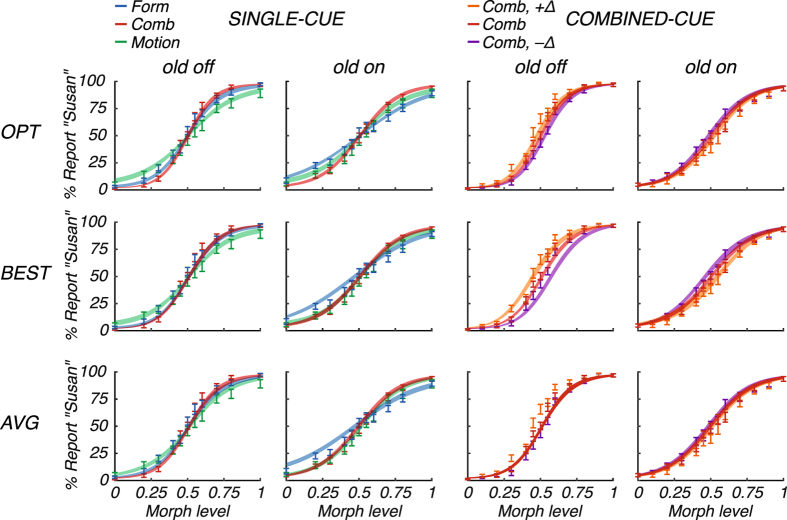
Figure 2.
Psychometric curves and model fits. Mean percentage of “Susan” reports are shown for single cues (“Form” in blue, “Motion” in green; note that the combined-cue condition “Comb” is also shown for comparison) and for combined cues (“Comb” in red, “Comb, +Δ” in orange, and “Comb, −Δ” in purple), each separated for “old off” (first column) and “old on” (second column). Error bars and shaded areas represent ±1 s.e.m. across subjects (n = 22), for data and model fit, respectively. Fits are shown for the optimal model (OPT; upper row), the best-cue model (BEST; middle row) and the simple-average model (AVG; lower row).

