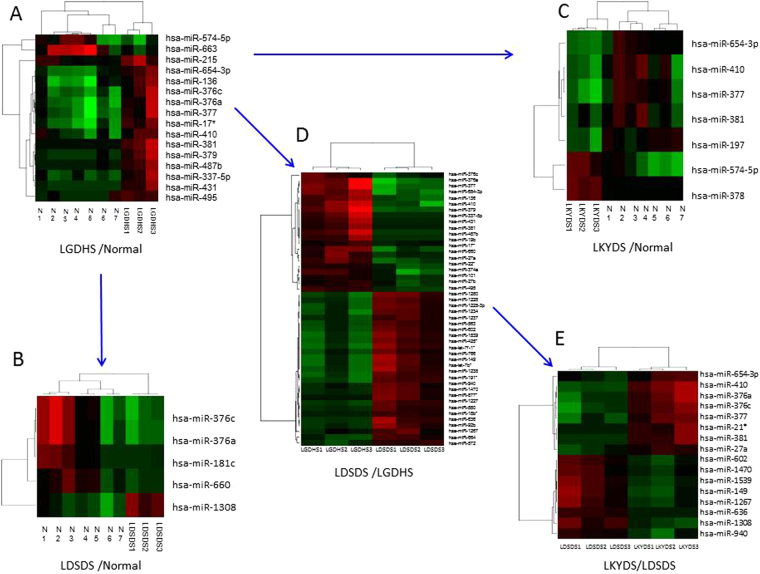
Figure 1.
Hierarchical cluster and heat map of HBC TCM syndromes. (A) represents the differential expressed miRNAs between LGDHS and Normal, (B) represents the differential expressed miRNAs between LDSDS and Normal, (C) represents the differential expressed miRNAs between LKYDS and Normal, (D) represents the differential expressed miRNAs between LGDHS and LDSDS, and (E) represents the differential expressed miRNAs between LDSDS and LKYDS.

