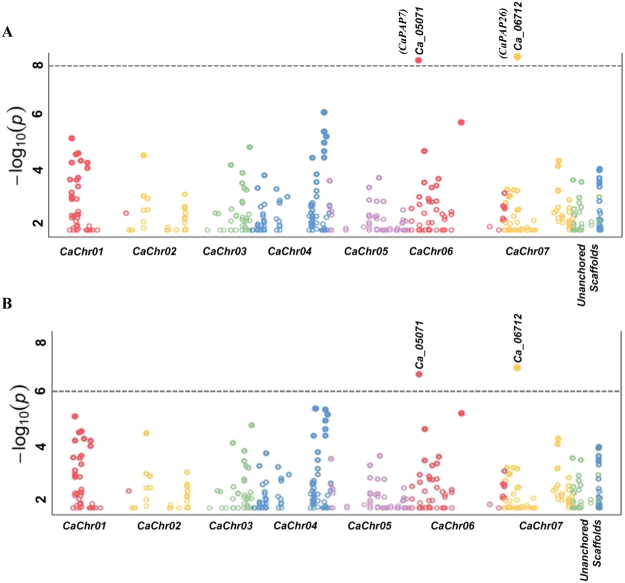
Figure 4.
Association of CaPAP7 and CaPAP26 with seed weight (A) and seed phytate content (B). The x-axis indicates the relative density of PAP gene based SNPs physically mapped on eight chromosomes and unannotated scaffold of Kabuli genome. The y-axis represents the −log10 p-value for significant association with traits. The SNPs with p-value ≤ 1 × 10⁻⁸ for seed weight (A) and 1 × 10⁻⁶ for seed phytate content (B) showing strong association are demarcated with dotted line.

