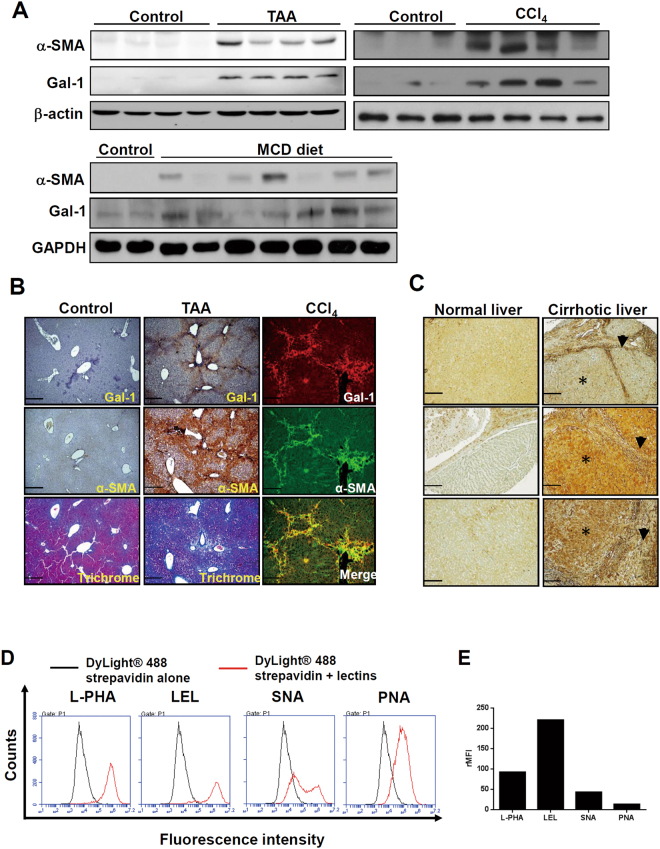
Figure 1.
The expression of galectin-1 and its binding lectins are associated with hepatic stellate cells (HSC) activation. (A) Gal-1 expression is upregulated in fibrotic livers. Mouse liver fibrosis was induced by an injection of thioacetamide and carbon chloride or by feeding a methionine- and choline-deficient (MCD) diet as described in “Materials and methods”. Liver tissues were homogenized for Western blotting. (B) Gal-1 is expressed in areas around the portal vein and areas of bridging fibrosis in fibrotic livers of mice. Tissue slides were stained with anti-Gal-1 and anti-α-SMA antibodies and Masson’s trichrome stain. The blue color indicates collagen. The brown color indicates a region positive for Gal-1 and α-smooth muscle actin (α-SMA). For immunofluorescence analysis, the slides were incubated with anti-Gal-1 and anti-α-SMA antibodies, and the signal was visualized by Alexa Fluor-488 and -594 secondary antibodies. (C) Gal-1 is overexpressed in cirrhotic liver tissues compared to normal liver tissues. Normal liver and cirrhotic tissues were obtained from US Biomax (LV805). P’t represents patient. Three representative samples of normal and cirrhotic livers are respectively shown in the left and right panel. Asterisks indicate parenchymal cells, and arrowheads indicate non-parenchymal cells. (D) Glycosylation signatures of LX-2 cells, an activated hepatic stellate cell line. Cell surface glycans of LX-2 cells were detected by different types of lectins as described in “Materials and methods”. (E) Quantitation of the relative mean fluorescence intensity (rMFI) of different lectins. The rMFI was calculated by comparing the mean fluorescence intensity of different lectins to that of DyLight® 488 streptavidin alone, and results are shown as folds of change.

