Figure 6.
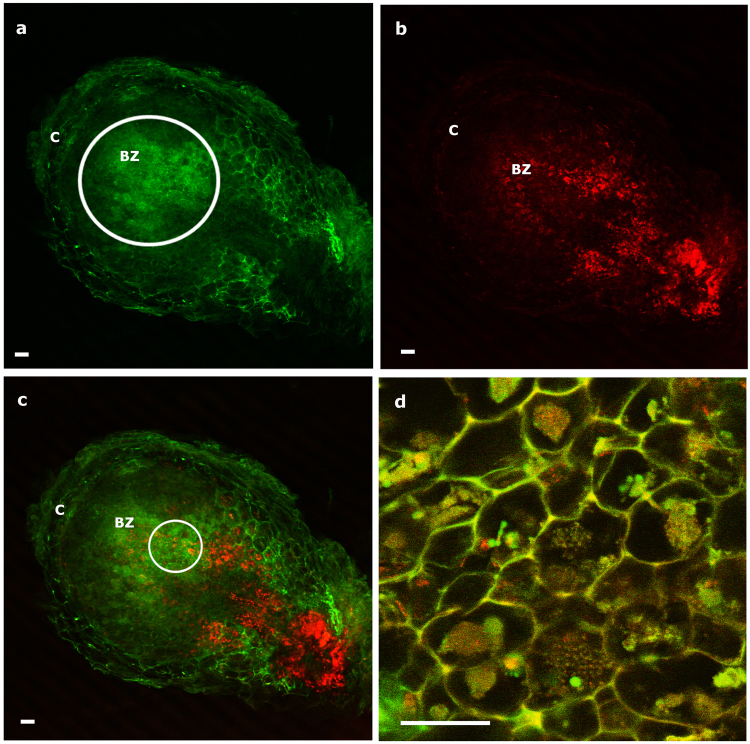
Trifolium longitudinal nodule section (20 dpi) showing the distribution of infected cells after co-inoculation with Micromonospora ML01-gfp and Rhizobium E11-mCh captured by CLSM. (a) Image obtained with the green channel for the localization of Micromonospora. The circled area indicates fluorescence emitted by Micromonospora concentrated in the bacteroid zone. (b) Image captured with the red channel for the localization of Rhizobium. (c) Combination of images a and b. (d) Detail of infected zone showing the co-localization of Micromonospora and Rhizobium in the host cells. The white circle in 6c shows the area where image (d) was captured. Bars: 60 µm (a–c); 20 µm (d). dpi, days post inoculation; C, cortex; BZ, bacteroid zone.

