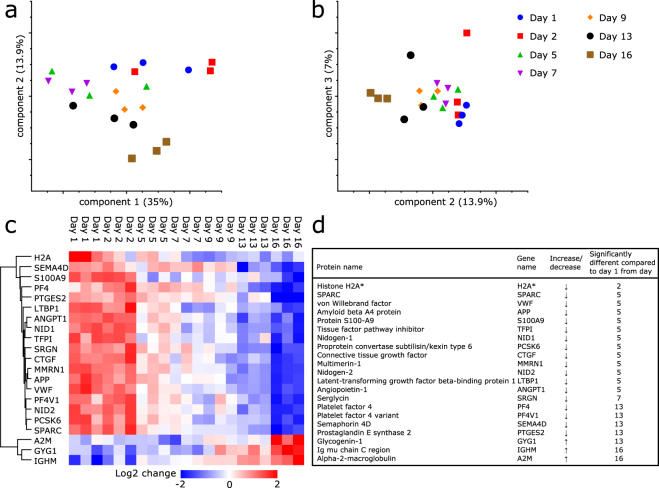
Figure 1.
Principle component analysis and proteins with significantly changed levels during platelet storage. (a) Principle component analysis performed on proteins identified in all samples measured (n = 1753). Principle component (PC) 1 captures 35%, PC2 13.9%. (b) Including PC3, 7% of differences were explained. (c) Heat map and hierarchical clustering (based on average Euclidean distance and preprocessed with k-means) of proteins with significantly changed levels (n = 21). Proteins are indicated by gene names. Heat map colors (see legend) are based on the z-scored LFQ data (log2) reported in Supplementary Table S1. (d) List of 21 proteins changing in abundancy during storage. Time period from which protein was significantly different compared to day 1 is indicated (P < 0.05). *Peptides identified and quantified for H2A correspond to the sequence of more than 1 histone H2A variant. These peptides originate from one or more of the following histones: H2AFJ, HIST1H2AJ, HIST1H2AH, HIST1H2AC, HIST3H2A, HIST1H2AD, HIST1H2AG, HIST1H2AB, HIST2H2AB and H2AFX.

