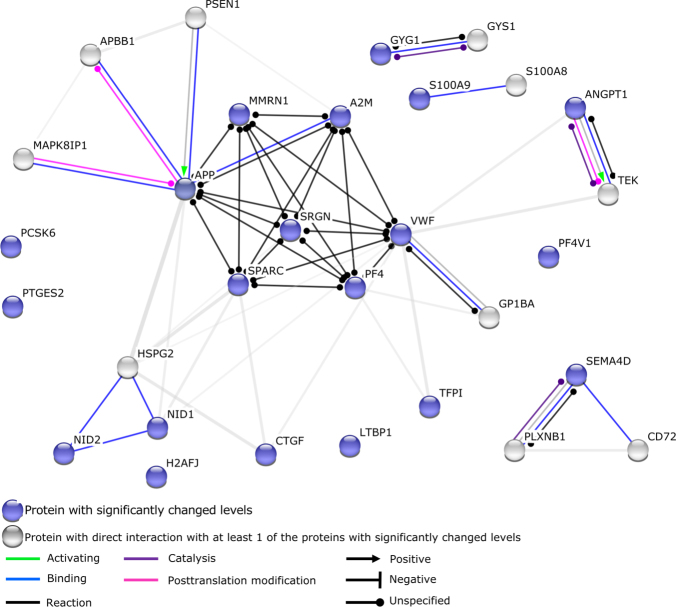
Figure 3.
STRING analysis. STRING analysis monitors potential interaction between the candidate proteins identified in this study. All proteins with significantly changed levels during storage were included, except for IGHM (constant region of heavy chain IgM) which is not annotated in the STRING analysis tool. Blue colored circles represent proteins levels of which changed significantly during storage. Grey circles represent proteins which directly interact with at least one of the proteins of which levels were changed significantly during storage. Interactions between different proteins are indicated by colored lines and arrowheads as depicted in the figure.

