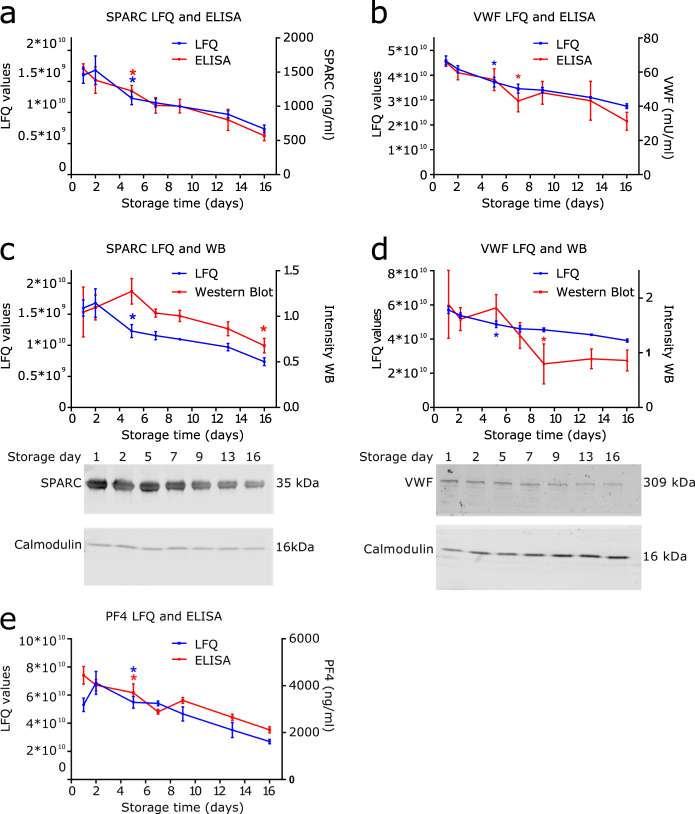
Figure 4.
Reduced levels of α-granule proteins SPARC, VWF and PF4 during storage. (a) Non-imputed LFQ values of SPARC (blue) and SPARC levels as measured with ELISA (red). (b) Non-imputed LFQ values of VWF (blue) and VWF levels as measured with ELISA (red). (c) Western blot analysis of SPARC, LFQ values (blue) and intensities of Western blot (red). (d) Western blot analysis of VWF, LFQ values (blue) and intensities of Western blot (red). Calmodulin was used as loading control. Bands were normalized according to intensity of calmodulin (loading control), and average intensity per membrane was normalized to 1. (e) Non-imputed LFQ values of PF4 (blue) and PF4 levels as measured with ELISA (red). Data represents mean ± standard deviation (n = 3), *P < 0.05 compared to day 1 from this time point onwards. Uncropped immunoblots of SPARC, VWF and calmodulin can be found in Supplementary Data S5.

