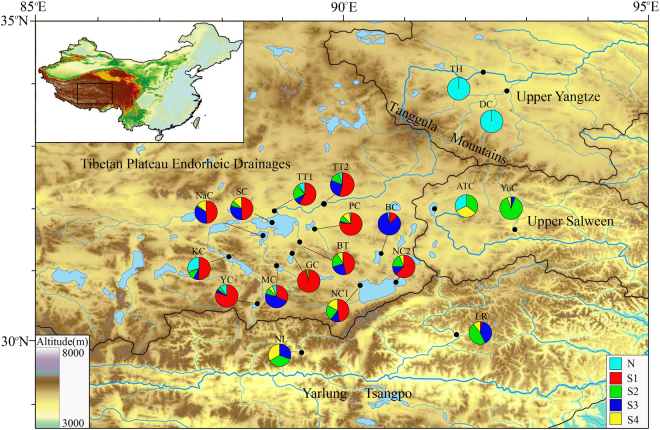
Figure 1.
Location and haploclade composition of each sampling site in this study. Pie charts exhibit the frequency of lineages or sublineages in each population. Five colours (cyan, red, green, blue and yellow) correspond to one North lineage (N1) and four South sublineages (S1, S2, S3 and S4) in the D-loop phylogram, respectively. The boundaries of the main drainage basins are also shown by black lines. Whole names for each site are listed in Table 1. The map was drawn using ArcGIS v10.0 and Adobe Illustrator CS5 v15.1.0.

