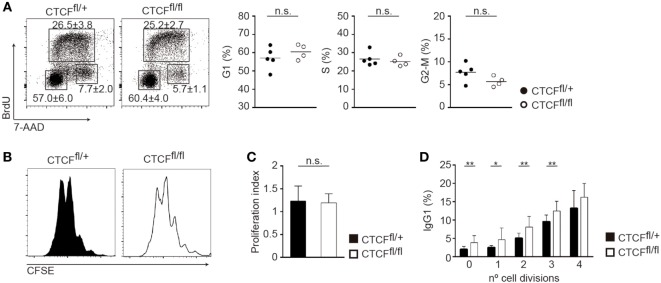
Figure 3.
CCCTC-binding factor (CTCF) deficiency does not affect cell proliferation. (A) Cell cycle analysis of spleen B cells from CTCFfl/+ (n = 4) and CTCFfl/fl (n = 4) mice 48 h after lipopolysaccharide (LPS) + IL-4 stimulation. DNA content was analyzed by flow cytometry after BrdU incorporation (30 min pulse) and 7-AAD staining. Representative plots are shown. Quantification of G1, S, and G2/M phase proportions is shown on the right. (B) CFSE staining of spleen B cells from CTCFfl/+ and CTCFfl/fl mice 72 h after LPS + IL-4 stimulation. (C) Proliferation index of spleen B cells from CTCFfl/+ (n = 15) and CTCFfl/fl (n = 14) mice 72 h after LPS + IL-4 stimulation measured by CFSE. (D) Percentage of IgG1 expression on each cell division measured by CFSE 72 h after LPS + IL-4 stimulation. p(0 division) = 0.0055; p(1 division) = 0.0298; p(2 division) = 0.0048; p(3 division) = 0.005. Numbers indicate percentages ± SD. Statistical analysis was done by two-tailed unpaired Student’s t-test.

