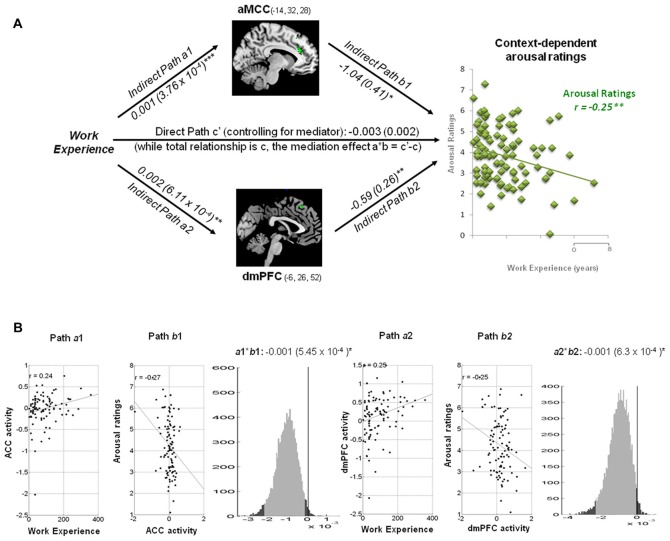
Figure 5.
Mediation analysis on context-dependent arousal ratings. (A) Path diagram shows the relationship between variables in the path model. Work experience (left) as the predictor variable predicts the activity in the ACC (top) and dmPFC (bottom). The connection of work experience to each brain mediator (ACC or dmPFC) is the a path. The lines are labeled with path coefficients, and standard errors are shown in parentheses. The connection of each mediator to the outcome (arousal ratings) is the b path. They are calculated controlling for work experience and for other mediators, as the standard in mediation models. ***p < 0.001, **p < 0.01, *p < 0.05, two-tailed. The direct path is the c′ path, which is calculated controlling for both mediators. (B) Substantiation of the mediation path a, b and c. Regression scatterplots demonstrate the relationships between predictor (work experience) and ROIs (path a1 and a2). Partial regression scatterplots depict the relationships between ROIs (ACC and dmPFC) and arousal ratings (path b1 and b2). The mediation effect (a1*b1 and a2*b2) is substantiated by the bootstrapped distributions. The range on the x-axis spanned by the lighter gray portion of the histogram is the 95% confidence interval for the effect. None of each Burnout subscale modulated the mediation effect of arousal ratings.

