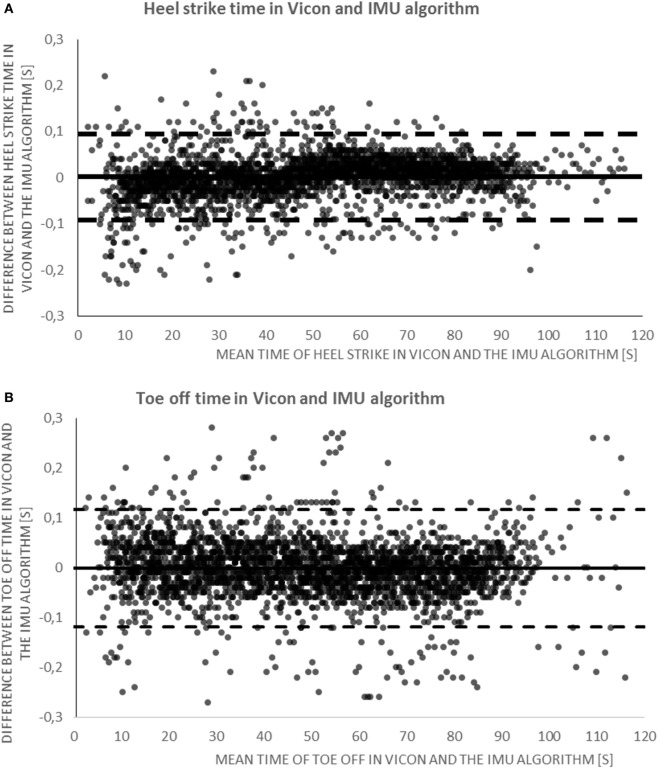
Figure 4.
(A) Bland–Altman plot illustrating the agreement for time of heel strike detection between the algorithm and the gold standard. The continuous line is the mean, and dashed lines are the 95% confidence intervals (CIs) of step observation difference (in seconds). (B) Bland–Altman plot illustrating the agreement for time of toe off detection between the algorithm and the gold standard. The continuous line represents the mean, and dashed lines are the 95% CI of step observation difference (in seconds). IMU, inertial measurement unit.

