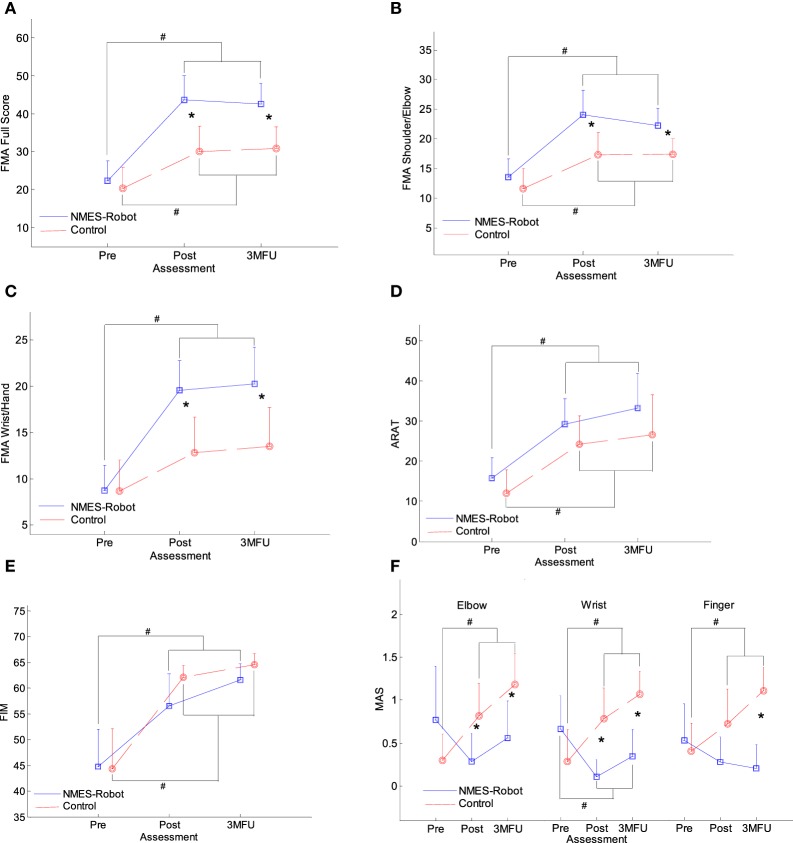
Figure 4.
The clinical scores [evaluated before the first and after the 20th training session, as well as the 3-month follow-up (3MFU)] of the participants in both neuromuscular electrical stimulation (NMES)-robot and control groups: (A) Fugl-Meyer Assessment (FMA) full scores, (B) FMA shoulder/elbow scores, (C) FMA wrist/hand scores, (D) Action Research Arm Test (ARAT) scores, (E) Function Independence Measurement (FIM), and (F) Modified Ashworth Score (MAS) scores at the elbow, the wrist, and the fingers, presented as mean value with 2-time SE (error bar) in each evaluation session. The solid lines are for the NMES-robot group, and the dashed lines are for the control group. The significant inter-group difference is indicated by “*” (P < 0.05, one-way analysis of covariance), and “#” is used to indicate the significant intragroup difference (P < 0.05, one-way analysis of variance with Bonferroni post hoc tests).

