Figure 1.
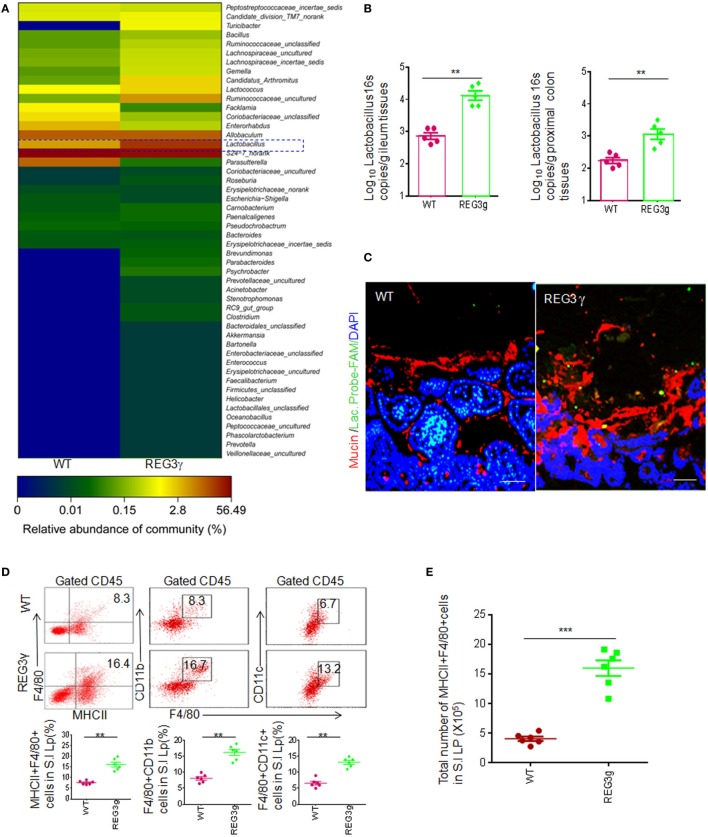
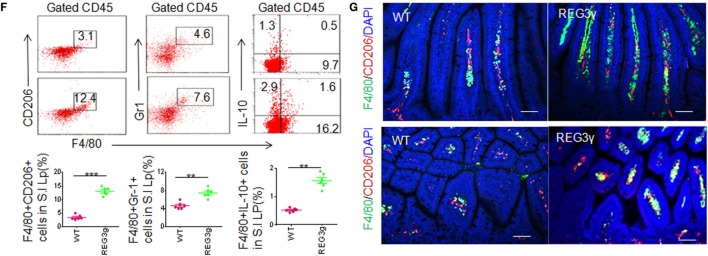
REG3γ overexpression causes alterations of gut microbiota and expands the pools of anti-inflammatory macrophages. (A) 16S rRNA analyses of gut microbiota in huREG3γtgIEC and control littermate WT mice. The weaned huREG3γtgIEC (REG3γ) and control littermate WT mice were reared in different cages, and then 16S rRNAs from pooled small intestinal content samples (n = 5, 7- to 8-week-old male mice fed normal chow) were amplified using primers that targeted the V3–V4 regions of the 16S rRNA. The samples were clustered at genus levels using the sample genus count matrices. WT, wild-type; REG3γ, huREG3γtgIEC mice. See also NCBI with accession number SAMN04569211 and SAMN04569229. Data are a representative of three independent experiments. (B) Q-PCR of Lactobacillus genus in the ileum and proximal colon tissues of WT and huREG3γtgIEC mice fed normal chow (n = 5). Standard curves were prepared from serial dilution of Escherichia coli genomic 16S rRNA. (C) Fluorescence in situ hybridization and immunostaining of ileum fragments in 7- to 8-week-old male huREG3γtgIEC mice (REG3γ) and control littermate WT mice. The representative images from five mice per group; Scale bars = 40 μm. (D) Flow cytometry of MHCII(+)F4/80(+), F4/80(+)CD11b(+), and F4/80(+)CD11C(+) macrophages in small intestinal (S.I) lamina propria of huREG3γtgIEC (REG3γ/REG3g) and control littermate WT mice. The proportion of MHCII(+)F4/80(+) macrophages in the S.I lamina propria of WT and huREG3γtgIEC mice were compared (n = 6; lower). (E) Comparison of total MHCII(+)F4/80(+) macrophages in the whole S.I lamina propria of huREG3γtgIEC (REG3g) and control littermate WT mice (n = 6). (F) Flow cytometry of F4/80(+)CD206(+), F4/80(+)Gr-1(+), and F4/80(+)IL-10(+) macrophages in the S.I lamina propria of huREG3γtgIEC and control littermate WT mice. The proportion of MHCII(+)F4/80(+), F4/80(+)Gr-1(+), and F4/80(+)IL-10(+) macrophages in WT and huREG3γtgIEC (REG3g) mice were compared (n = 6). (G) Immunostaining of F4/80(+)CD206(+) macrophages in the ileum tissues of huREG3γtgIEC (REG3γ) and control littermate WT mice. The representative images from six mice per group; scale bars = 40 μm. *p < 0.05, **p < 0.01, and ***p < 0.001 (t-test, mean ± SD); NS, no significant. See also Figures S1–S3 in Supplementary Material.


