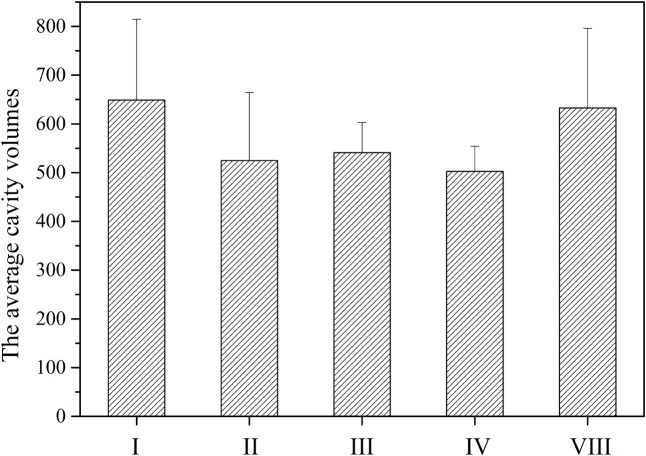
FIGURE 7.
The average cavity volumes of TE catalytic pockets of NR-PKSs in groups I–IV and VIII. The cavity volumes were calculated and identified by CASTp and CAVER. The cavity volume of TE protein in each NR-PKS group was defined as the average value of cavity volumes of all TE model structures in the same group of NR-PKSs. Error bars represent the standard deviation.

