
Figure 4.
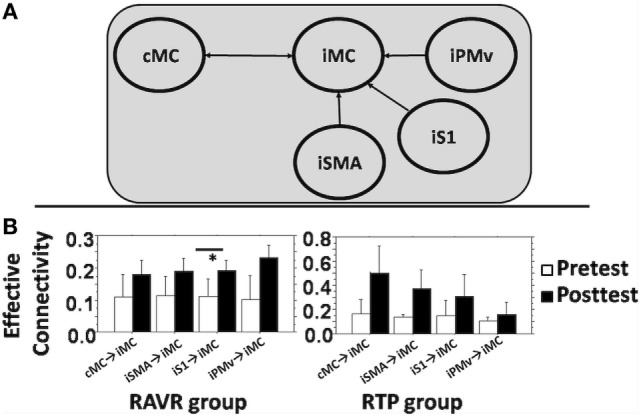
(A) DCM full model used to study connectivity between contralesional motor cortex, iS1, ipsilesional supplementary motor area, iPMv, and iM1. (B) Average change in DCM parameters (A + B) in both groups for each connectivity edge. Error bars show the SD. * denotes statistically significant difference.