Figure 1.
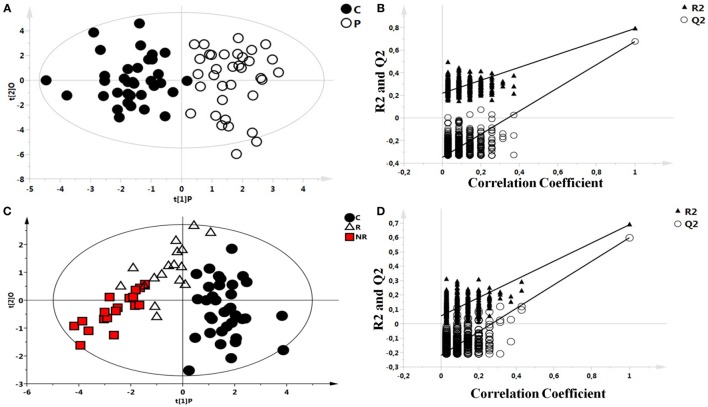
Scores plots obtained from nuclear magnetic resonance spectra of serum samples from controls and patients with epilepsy. (A) Scores plot from the multivariate orthogonal partial least square discriminant analysis model between controls (C): C (●) and patients with epilepsy: P (O): each point represents a single serum spectrum, with the position determined by the contribution of the 159 variables. (B) Validation of the corresponding model by permutation test (n = 500). (C) Scores plot from the multivariate orthogonal partial least square discriminant analysis of a three classes model: healthy subjects (●), responder (R) patients (Δ), and non-responder (NR) patients ( ). (D) Statistical validation of the corresponding model by permutation test.

