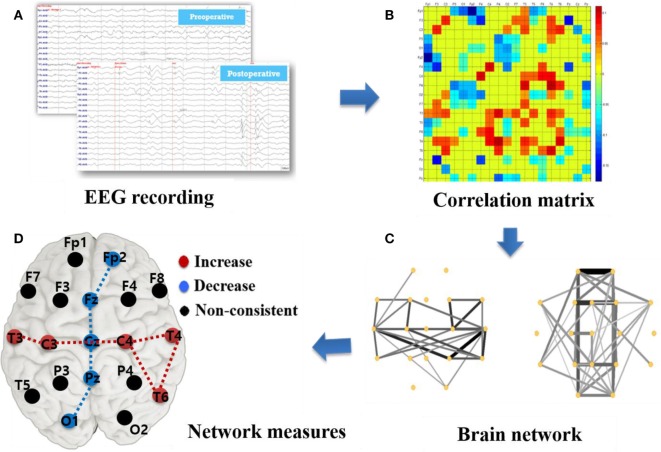
Figure 1.
Illustration of network construction and analysis based on surface electroencephalographic (EEG) recording. (A) EEG recording: 19 channels surface-EEG recording with a sampling frequency of 200 Hz. (B) Correlation matrix (MATLAB pcolor plot): correlation coefficients among 19 channels with the diagonal elements set as 0. (C) Brain network plots: the edge strength is represented as thickness of the line. (D) Graph measures: calculation of brain network parameters, such as degree, betweenness centrality, cluster coefficient, characteristic path length, and efficiency.

