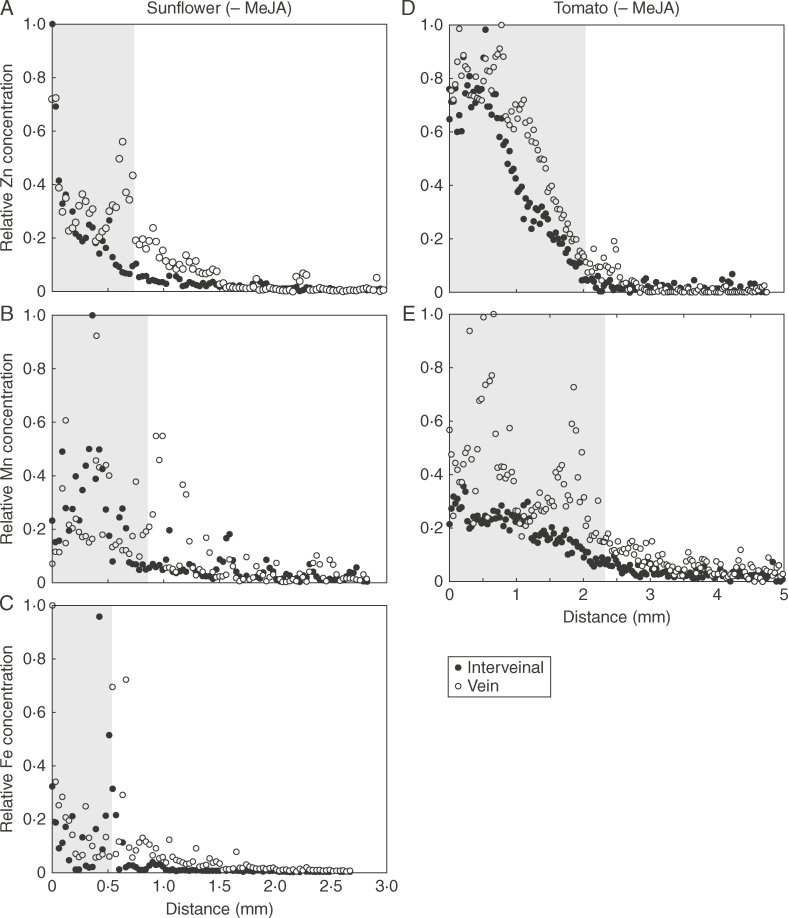
Fig. 7.
Comparison of nutrient diffusion in vein and interveinal tissues of sunflower control (A–C) and tomato control (D–E) leaves after 6h of foliar application. The shaded area represents the portion of the leaf under the droplet. Soybean control and Fe for tomato control are not shown due to the comparatively low absorption or no detectable veins under the droplets.

