
Figure 7.
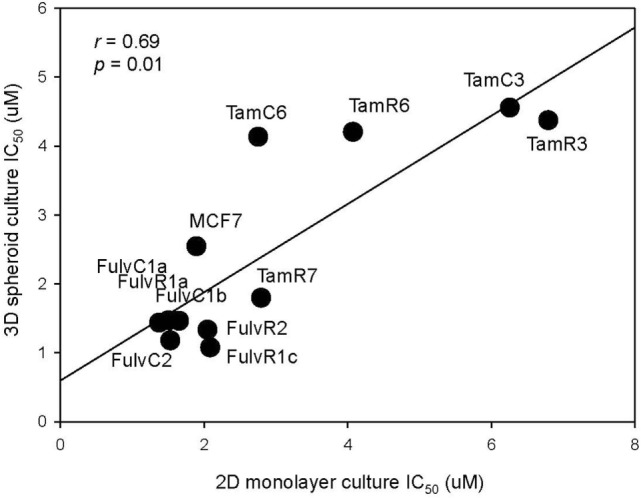
Correlation of drug sensitivity in monolayer cultures and in three dimension (3D) spheroid cultures. Plot of IC50 values for LGK974 in 2D monolayer culture (x-axis) and 3D spheroid culture (y-axis). Experiments were performed in triplicate wells and performed twice (Spearman’s rank correlation coefficient, r = 0.69, p = 0.01).