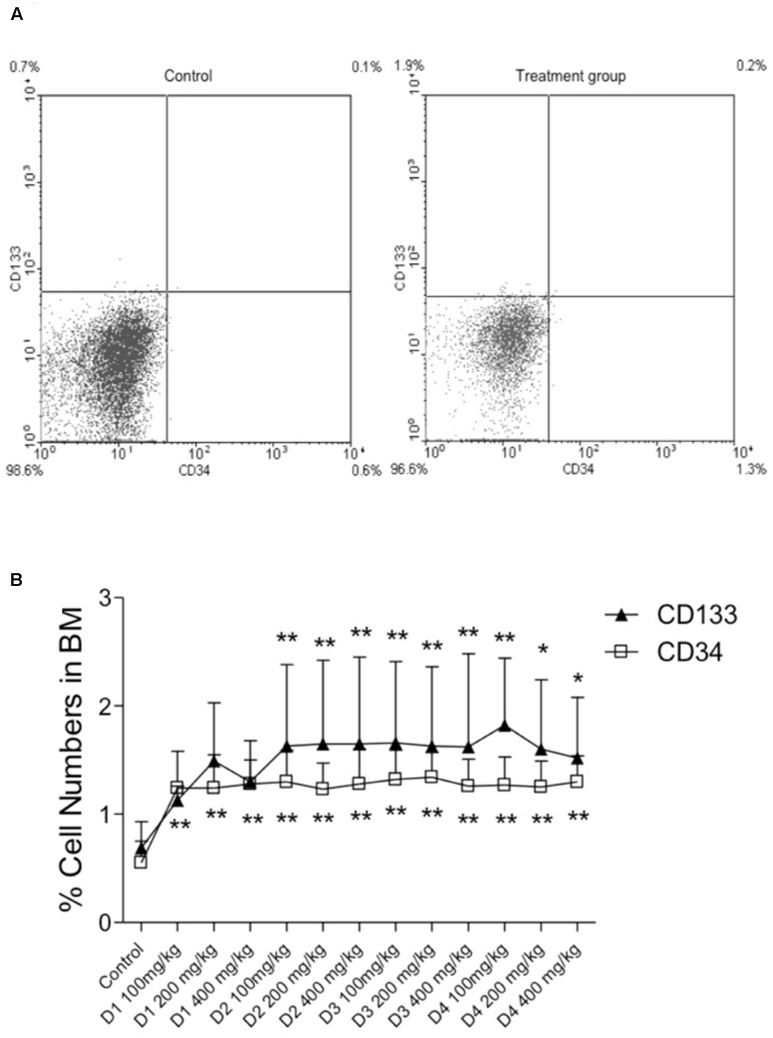
FIGURE 5.
Levels of CD34 and CD133 positive cells in bone marrow at 14 days post-MI. (A) Representative FACS data of bone marrow. (B) Percentage number of CD34 and CD133 positive cells for each concentration (100, 200, and 400 mg/kg) of date palm fruit extracts (D1, D2, D3, and D4). Symbols indicating the significant differences: ∗p < 0.01 vs. control, ∗∗p < 0.001 vs. control.

