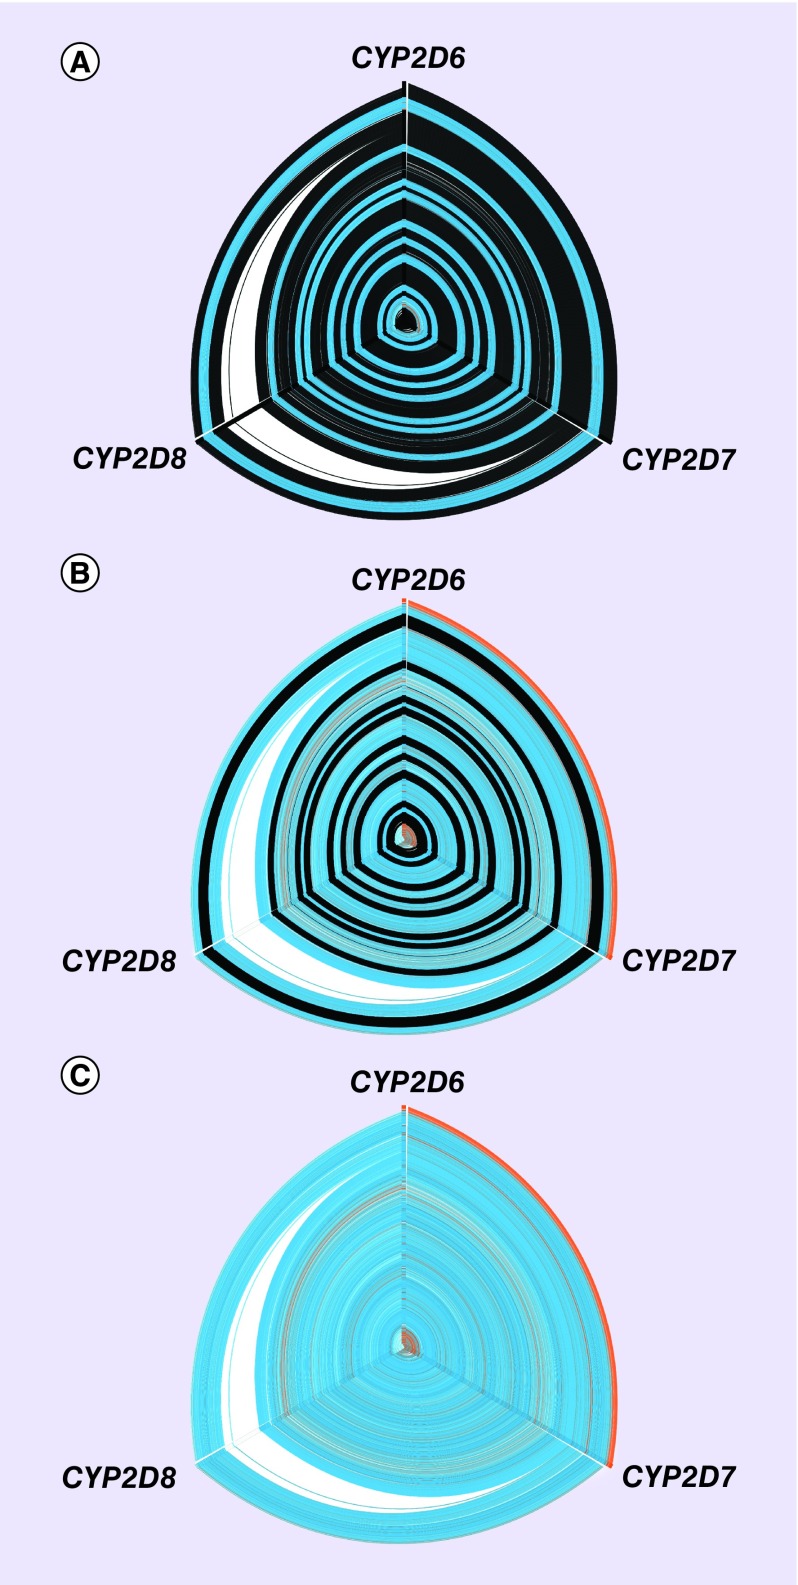
Figure 1. . Hive panel displaying multiple sequence alignment of CYP2D6, CYP2D7 and CYP2D8.
The hive plot edges display sequence similarity between CYP2D6-CYP2D7, CYP2D7-CYP2D8 and CYP2D8-CYP2D6 (clockwise from top). Three principle axes (0, 120 and 240°) of the hive plots represent the nucleotide composition of the multiple sequence alignment for the indicated gene: (A) exonic sequences (intronic sequences shown in black), (B) intronic sequences (exonic sequences shown in black) and (C) exonic and intronic sequences.
ClustalW was used to align the three genes (plus flanking 300 bp for each gene). Blue: aligned sequence is identical across the three genes; orange: aligned sequences are identical between the labeled genes; white: sequence gaps created by inserted nucleotides unique to the principle axis colored white.

