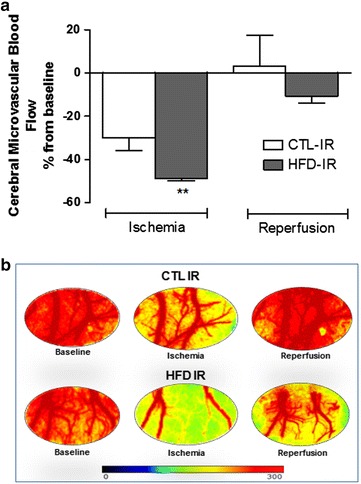
Fig. 1.

Cerebral microvascular blood flow assessed by laser speckle contrast imaging during cerebral ischemia and reperfusion. a Values represent the percentage of variation from basal values related to ischemia and reperfusion. b Representative images of laser speckle contrast imaging of the brain cortex of rats at baseline, at 30 min of ischemia and after 60 min of reperfusion in animals fed a control diet or high-fat diet and submitted to brain ischemia and reperfusion (CTL-IR and HFD-IR). Values represent the mean ± SEM, n = 5 per group. **p < 0.01 versus basal values
