Figure 2.
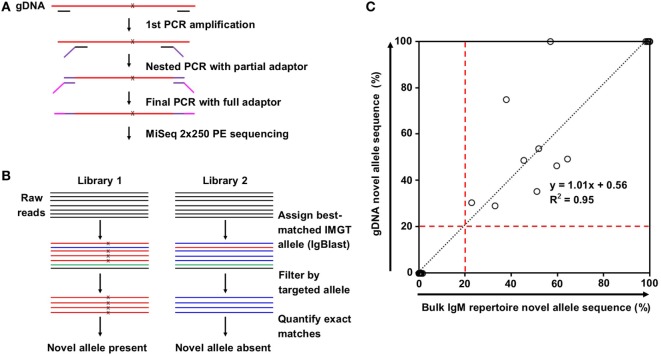
Novel allele validation by targeted genomic DNA (gDNA) sequencing. (A) Overview of targeted gDNA amplification and library preparation. x indicates predicted single nucleotide polymorphism (SNP) on novel allele compared to the closest IMGT reference germline allele. (B) Overview of genomic DNA (gDNA) sequencing data analysis for the presence (left) and absence (right) of a novel allele resulted from SNP(s). Color indicates best-matched IMGT reference germline allele assignment; x indicates SNP to the closest IMGT reference germline allele. (C) Correlation between the percentage of novel allele sequences in bulk IgM repertoire data (%) and the percentage of novel allele sequences in gDNA data (%). Most points are clustered at the origin (N = 30) or the top right (N = 9). Black dotted line represents the linear regression; red dashed lines indicate the novel allele calling threshold.

