Fig. 3.

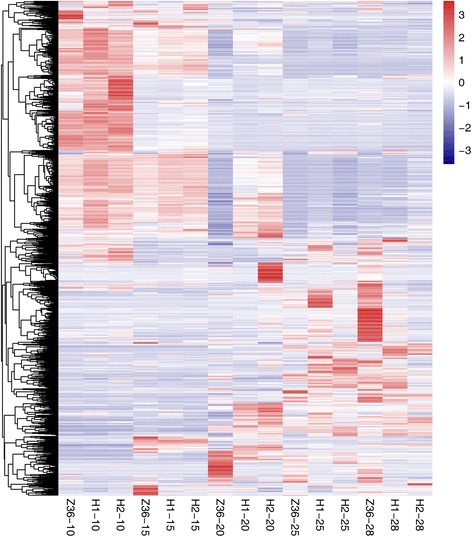
A heat map of 1801 DEGs from 15 samples. H1, H2 and Z36 represent MBI9915, MBI9749 and CCRI36, respectively. 10 = 10 DPA, 15 = 15DPA, 20 = 20DPA, 25 = 25DPA, and 28 = 28DPA

A heat map of 1801 DEGs from 15 samples. H1, H2 and Z36 represent MBI9915, MBI9749 and CCRI36, respectively. 10 = 10 DPA, 15 = 15DPA, 20 = 20DPA, 25 = 25DPA, and 28 = 28DPA