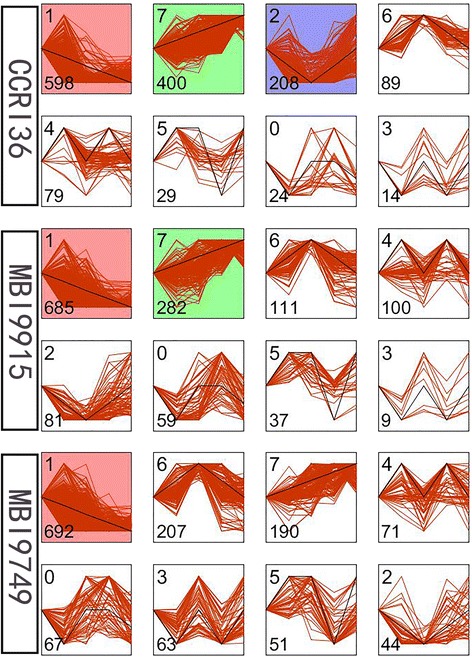
Fig. 9.

Different gene expression patterns in the three lines. Each square represents a trend of gene expression. The number in top left corner indicates the profile ID number; and the number in bottom left corner indicates the number of genes in that profile. The profiles were ordered based on the number of genes enriched thereof
