Fig. 4.

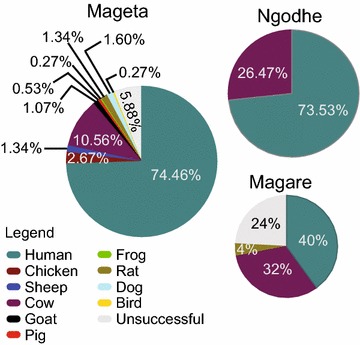
Proportion of blood-meal sources of anophelines. The pie charts show proportions of blood-meal sources among captured anophelines. The range of host species varied in all study areas

Proportion of blood-meal sources of anophelines. The pie charts show proportions of blood-meal sources among captured anophelines. The range of host species varied in all study areas