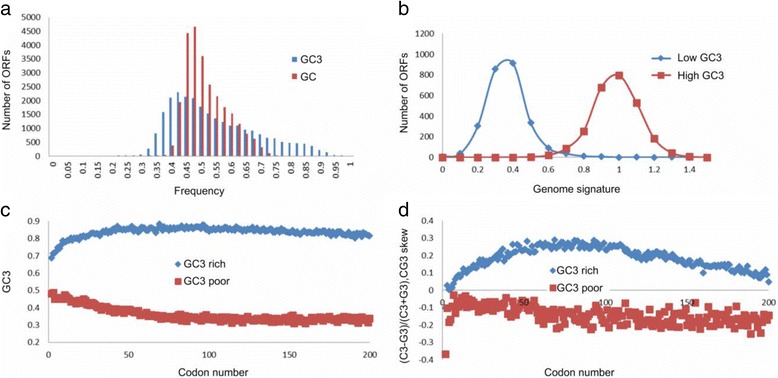
Fig. 4.

GC3 distribution in oil palm gene models. a GC (red) and GC3 (blue) composition of coding regions of E. guineensis. b Genome signature for GC3-rich and -poor genes. c GC3 gradient along the open reading frames of GC3-rich and -poor genes. d CG3 skew gradient along the open reading frames of GC3-rich and -poor genes. Figures c and d: x-axis is number of codons in coding sequence. Figure d: C3 and G3 is frequency of cytosine or guanine in third position of codon. CG3 is frequency of cytosine and guanine in third position of codon
