Fig. 4.

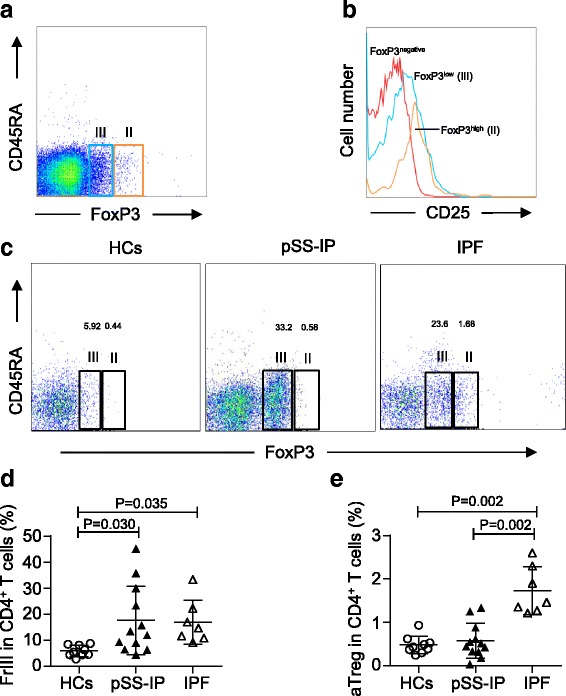
Analysis of CD4+/CD25+/Foxp3+ subpopulations from bronchoalveolar lavage (BAL) samples by cell-surface molecules and intracellular proteins. a Two subsets of Treg cells in BAL defined by the expression of CD45RA and Foxp3. Fraction II: CD45RA−Foxp3high activated T-regulatory cells (aTregs); Fraction III: CD45RA−Foxp3low cytokine-secreting cells. b The expression of CD25 in each fraction shown in (a). c Representative flow cytometric analysis of Treg subpopulations by the expression of CD45RA and Foxp3. d, e Percentages of Treg subpopulations among CD4+ T cells in the BAL of HCs and patients with pSS-IP or IPF
