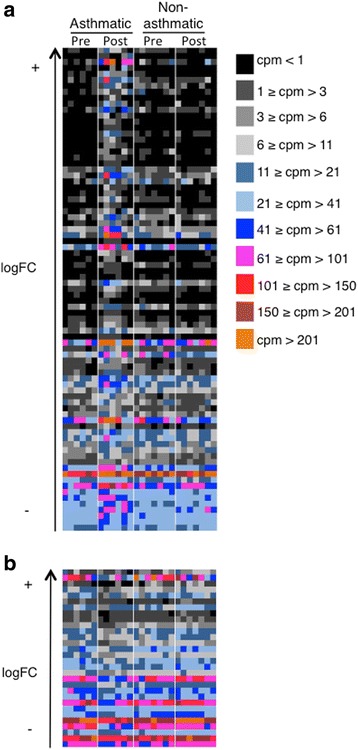
Fig. 5.

A heat map of differentially expressed genes significantly up- (a) and down-regulated (b) between asthmatic and non-asthmatic horses after challenge shows consistent change across individuals. Genes with positive log2FC were up-regulated in asthmatic compared to non-asthmatic horses, while genes with negative FC were down-regulated. Level of expression is expressed as cpm and ordered from highest (top) to lowest log2 fold-change (logFC, bottom). Significance threshold was set at FDR <0.05
