Figure 5.

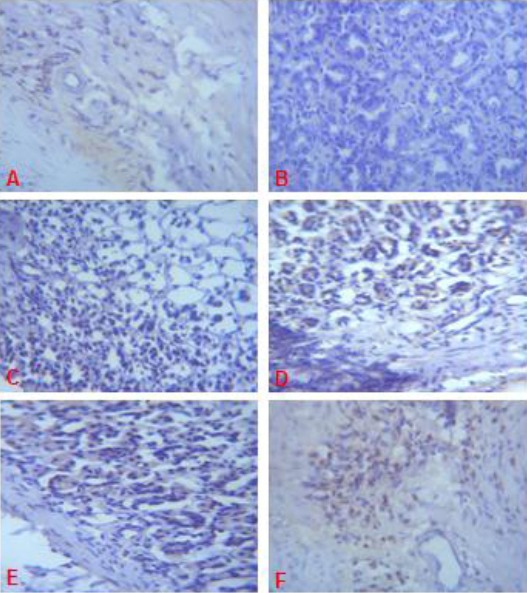
Expression of EGFR (brown colour) in the Gastric Corpus of Control (A), ASA Only (B), MP Treated (C, D, E) and OMZ Treated (F) Groups on Day 21. Note the EGFR immunoreactivity in the control and treatment groups. X400

Expression of EGFR (brown colour) in the Gastric Corpus of Control (A), ASA Only (B), MP Treated (C, D, E) and OMZ Treated (F) Groups on Day 21. Note the EGFR immunoreactivity in the control and treatment groups. X400