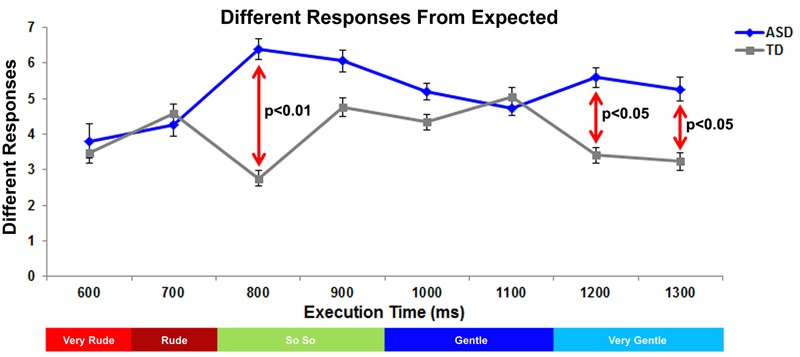
FIGURE 3.

Graph depicts the number of responses of vitality forms differing from expected judgment in ASD and TD groups. The red lines indicate the significant differences between ASD and TD groups. Below the graph, the colored bar indicates the expected response for each action execution time.
