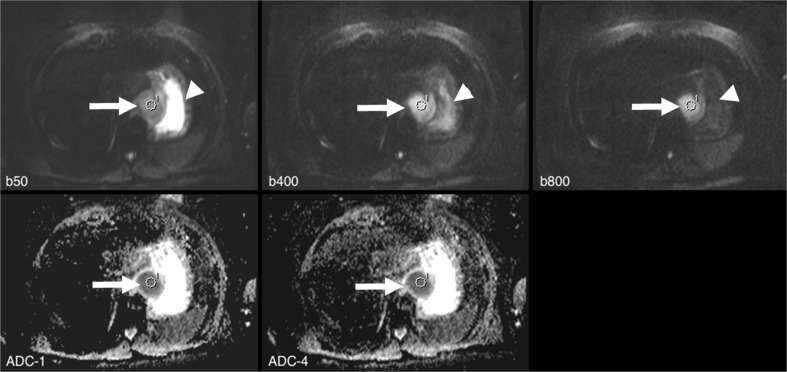
Fig. 1.
Examples of reading approaches: A 55-year-old male with advanced-stage oesophageal cancer (arrow). The image shows the reading set-up, with raw diffusion-weighted imaging (DWI) data on the top row (b50, b400, b800 [s/ mm2]), and, below, parametric apparent diffusion coefficient (ADC) maps of ADC_1 and ADC_4. The latter were automatically generated inline by the scanner or by the viewing workstation (MMWP, details see above). On raw DWI data, the typical signal decay of free water can be depicted in the adjacent stomach, whereas the lesion itself shows signal alteration indicative of diffusion restriction (arrowhead). The corresponding ROI 1 was placed within the tumour in the b800 image and ROI coordinates were automatically transferred to all other remaining series. This approach excluded user-dependent bias when comparing the ROI statistics between the given series

