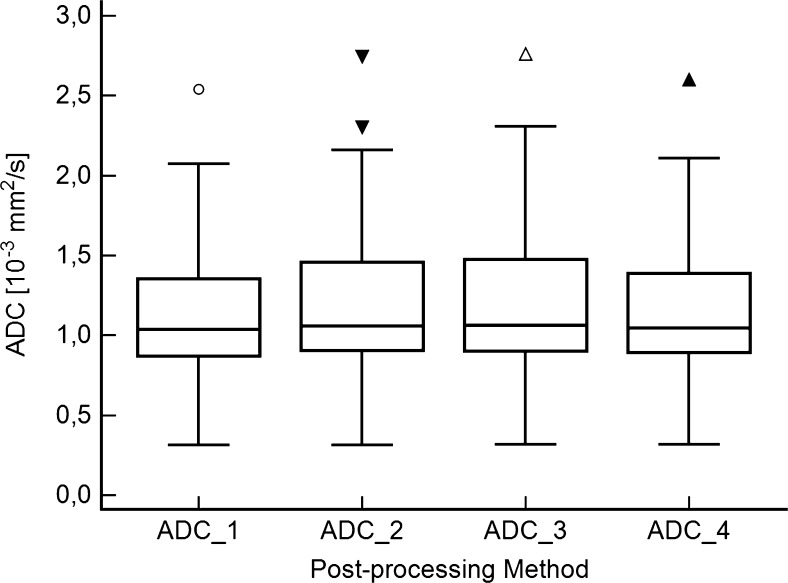
Fig. 4.
Box plots summarizing the distribution of apparent diffusion coefficient (ADC) values provided by the four different post-processing methods (PPMs). Median ranks between the PPMs showed significant differences (P ≤ 0.003). Note the different size of boxes and whiskers at the upper range of ADC values. In ADC_2, there were two outliers beyond the 97.5 quartile. One bone metastasis of lung cancer (ADC = 2.301) and one prostatic metastasis of a neuroendocrine tumour (ADC = 2.744) are shown. The latter caused all the outliers in the remaining PPMs

